Days Sales Outstanding Calculation Methods and Their Tradeoffs
Different revenue patterns demand different DSO formulas to avoid a misleading signal.

Days Sales Outstanding is a loan your business makes to its customers, interest-free, and DSO tells you how long that loan runs. Every day of DSO is one day of average daily credit sales sitting in someone else's bank account. Three different audiences read this number for three different reasons: finance uses it to forecast cash, lenders use it to size credit facilities, and acquirers treat a rising trend as a red flag for deteriorating revenue quality. All three are trusting a formula that breaks in four specific, well-documented ways.
The formula itself is simple: accounts receivable divided by credit sales, multiplied by the number of days in the period. Trouble starts with which accounts receivable number you plug in. Use the closing AR balance instead of the average, and one large invoice raised on the last day of the period inflates the numerator and skews the whole result. Averaging opening and closing AR instead of leaning on a single snapshot corrects this.
The second, more frequent failure, and the most common error in DSO reporting, is swapping total revenue in for credit sales, which flatters the result every time it happens.
The third failure is smaller but still adds up: using a round number like 90 days for a quarter that actually ran 92 days introduces roughly two percent of error into the answer. On its own, that might not move a decision. Stacked on top of the other errors, it compounds them.
The fourth is the quiet one. Treat that result as an estimate, not a precise read on collections.
Why the standard formula gives a misleading reading when revenue is uneven
The standard formula assumes credit sales land evenly across the period, day after day, like clockwork.
The mechanism is worth walking through slowly, because it explains almost every confusing DSO reading finance teams run into. The AR balance in the numerator is a snapshot taken at the end of the period. The credit sales figure in the denominator is a rate measured across the whole period. When a big order lands near period end, it inflates the denominator immediately, while the AR balance hasn't caught up yet because nobody has had time to not-pay that invoice. The ratio drops. It looks like collections sped up. Nothing about collections changed at all.
A concrete example shows how much damage this can do. The formula just got fooled by timing.
The reverse happens too. In both directions, the number is reacting to when revenue happened to land, not to anything the AR team did or didn't do.
This is a structural weak point that doesn't even out over time, and any business with seasonal peaks, project-based billing, or fast revenue growth will run into it regularly, not occasionally. The cost appears when someone acts on the wrong signal. A finance team watching DSO drop from 47 to 40 days might ease off AR follow-up at precisely the moment they should be pushing harder, because the timing of a few large invoices moved the number while collection behavior stayed the same. A flattering DSO reading isn't neutral. It buys time for a real problem to get worse while everyone feels good about the spreadsheet.
The five main calculation methods and the conditions each one is built for
Each DSO method answers a different question about when, and why, payment is running slow. Picking the wrong one for your revenue pattern produces a number that answers a question nobody was asking.
Standard DSO, calculated annually, works fine for board decks and year-over-year comparison. The formula is average AR divided by credit sales, multiplied by 365. Using twelve months smooths out seasonality, which makes it the right number to bring to a lender or a board meeting. Its weakness is the same one covered above: it hides uneven sales within the period and stays vulnerable to denominator distortion. It's reliable mainly when monthly revenue holds fairly steady.
Monthly or quarterly DSO trades some of that stability for responsiveness. Use actual day counts (28 to 31 for months, 90 to 92 for quarters) instead of round numbers, or the small errors from the previous section start compounding here too.
Rolling 12-month DSO is a common choice for board packs and seasonal businesses, because it smooths out the seasonal bumps that make monthly numbers jump around. The cost is lag. A change made in October might not be visible in the rolling figure for several quarters, so it's a poor tool for judging whether this week's new process is working.
Countback DSO exists to handle revenue that lands unevenly across the period. If the AR balance is bigger than a given month's sales, that whole month counts and the remainder carries back further. Once the remaining balance fits inside a single month's sales, divide and multiply by that month's day count to finish. As a rule of thumb, reach for countback when monthly revenue is growing over 20% year-over-year, or when sales are seasonal. Running it quarterly alongside standard DSO is a good check that the headline number isn't being quietly distorted by one big receivable sitting at period end.
True DSO goes a level deeper still. Rather than blending anything into an average, it measures the actual age of every open invoice, weighted by value. It's the most accurate figure available, and the right tool to pull out when the headline DSO moves and nobody in the room can say why. It needs invoice-level data. Most finance teams report standard DSO day-to-day and save True DSO for diagnostic work. Teams running AI-assisted AR with invoice-level prediction can afford to run it routinely, and in more advanced ERP setups, it's starting to replace standard and countback DSO as the everyday default.
Best Possible DSO as a diagnostic gap rather than a calculation variant
Best Possible DSO is a reference point that turns any one of the five methods above from a single number into a two-number diagnostic. BPDSO shows what DSO would be if every customer paid exactly on time, using only current, not past-due, receivables. When customers sit on different terms, BPDSO becomes the weighted average of those terms.
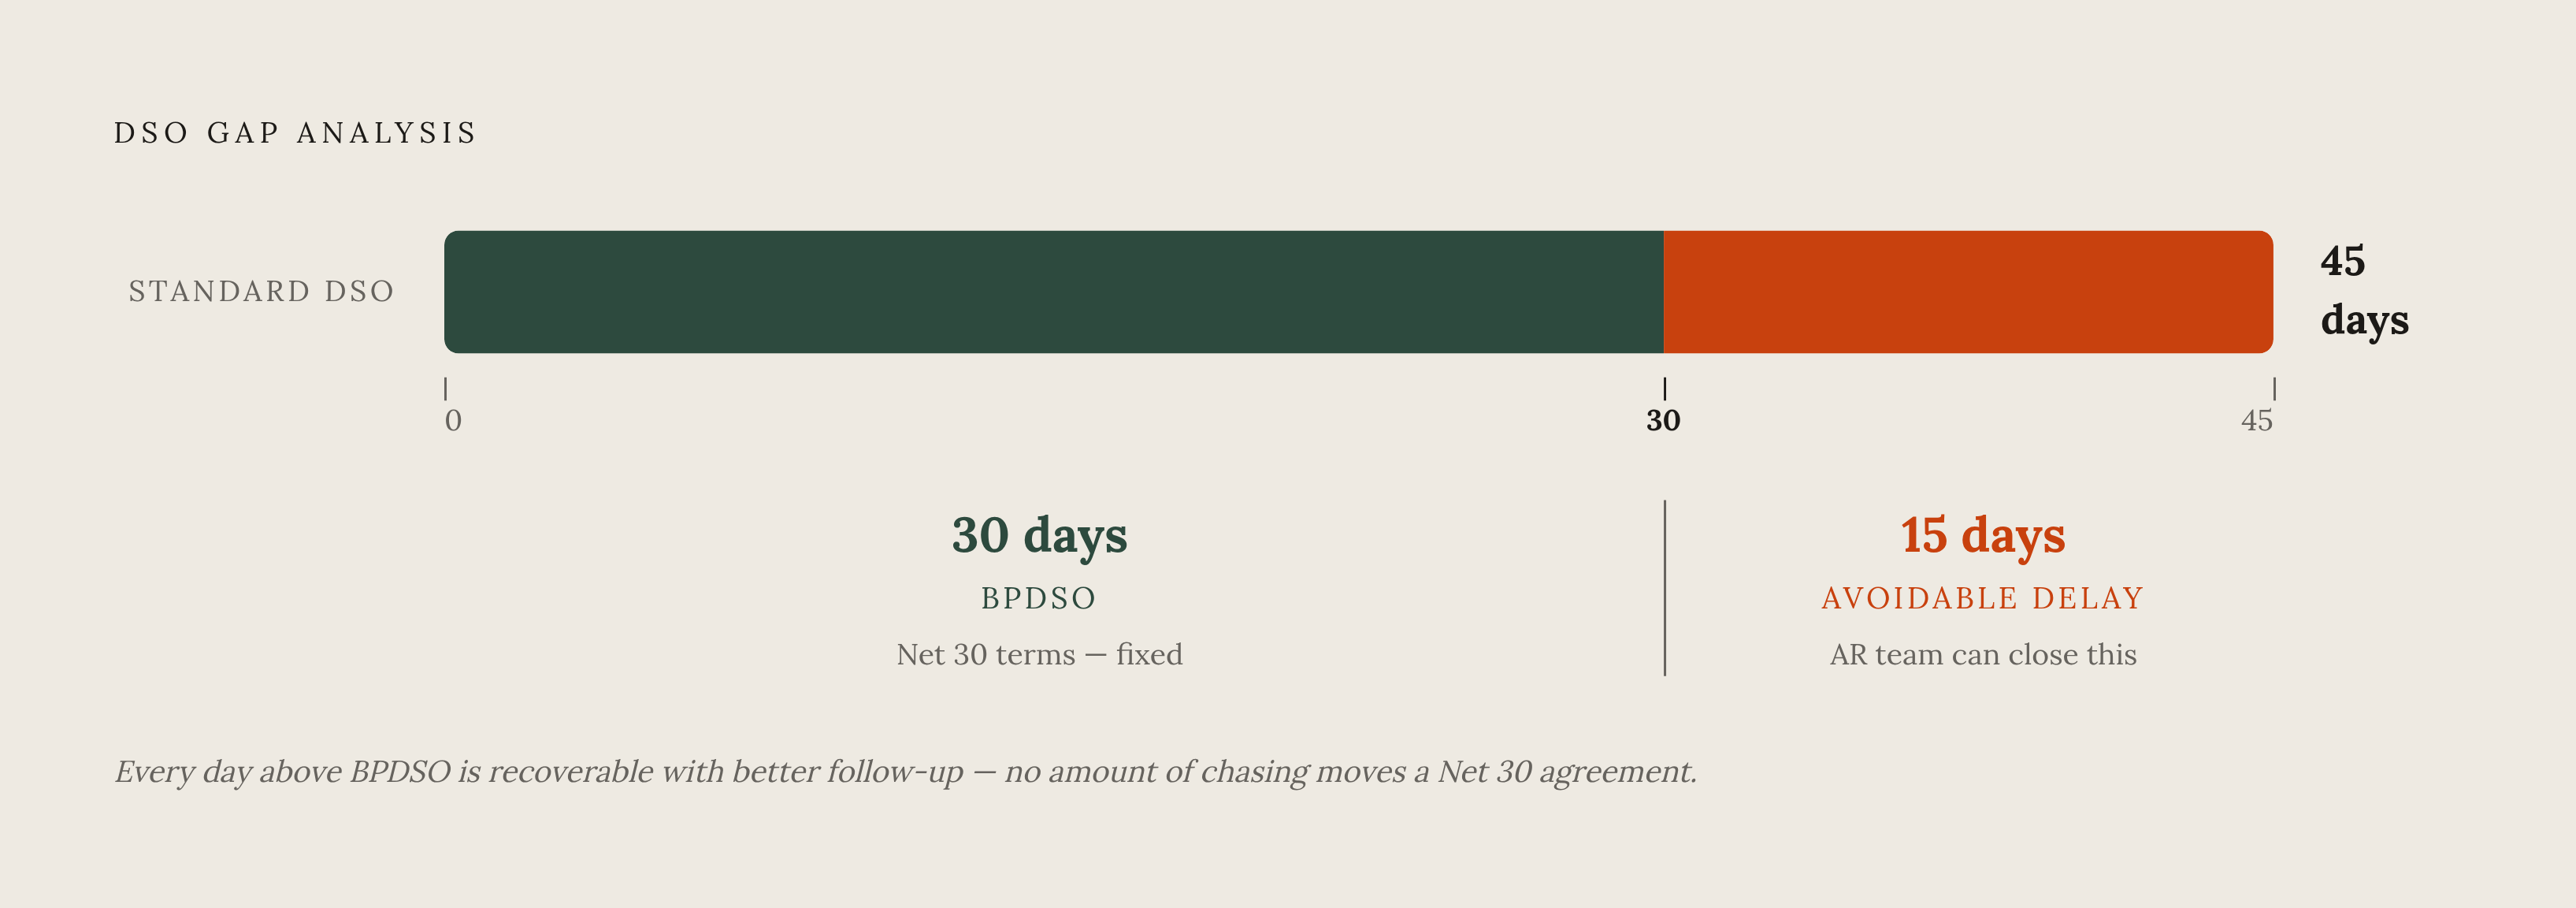
The gap between standard DSO and BPDSO measures collection inefficiency directly. It's measuring the delay that didn't have to happen. A company whose standard DSO matches its BPDSO is already collecting as fast as its own terms allow, full stop on the credit side. Every day above BPDSO is a day the AR team could, in theory, claw back with better follow-up.
That reframes the whole conversation around a DSO number. "Is 45 days good or bad?" is the wrong question, because good or bad compared to what. "How much of our 45 days is avoidable?" is the right one, and BPDSO gives a specific answer, which becomes a specific target. An AR process that's genuinely always on, escalating overdue invoices, working through portal friction, and chasing each one until cash actually lands, shrinks that avoidable gap. It does nothing to the structural piece set by payment terms, because no amount of chasing moves a Net 45 agreement to Net 15.
How revenue model and industry structure determine which method gives a reliable signal
The right DSO method is a function of how revenue actually shows up in a given business, and the formula that works cleanly for a wholesale distributor gives a structurally misleading number to a project-based contractor billing the same way.
Retail and B2C businesses sit at the simple end. Card and cash payments settle in one to three days, credit sales are a small slice of the total, and standard DSO is reliable because revenue arrives steadily. If retail DSO creeps above 25 days, the likely cause is a payment gateway failure, a fraud hold, or a credit issue, not a garden-variety collections problem.
Wholesale distribution running standard B2B terms sits a step up in complexity. Net 30 terms typically produce a 28 to 50 day range, and standard or rolling 12-month DSO fits this pattern well. What separates strong performers from weak ones here usually comes down to something simple: whether reminders start before the due date or only after it's already passed.
SaaS and subscription businesses benefit from monthly recurring billing, which keeps DSO lower and steadier than most other models. Companies that can negotiate annual prepayment structures often see DSO drop sharply as a result.
Manufacturing introduces real complexity. Countback DSO fits better here, because standard DSO will track invoice timing more than it tracks actual payment behavior.
Construction and other project-based businesses push the hardest on method choice. Progress billing tied to milestones, retainage held back until project completion, and multi-tier payment chains running from owner to general contractor to subcontractor all make high DSO a structural feature of the business, not evidence of a collections failure. Construction averages 72 days, ranging from 55 to 95 on Net 30 stated terms. Countback is the only method built to separate what the project structure demands from what's genuinely avoidable delay.
Healthcare runs into a different structural wall entirely. Healthcare DSO averages 58 days, with a range of 42 to 75 on Net 45 terms. A high number here mostly reflects the payer system, not the performance of the AR team, so reading it honestly means stripping out the payer-driven delay before judging anything.
Reading your DSO against benchmarks without being misled by them
A benchmark only means something once it's read against two things in order: your own payment terms first, your sector second. An absolute DSO number without either anchor doesn't tell anyone much of anything.
Terms come first because the same number means opposite things depending on context. A business invoicing on Net 30 and collecting in 38 days is performing well. A business on Net 7 terms collecting in that same 38 days has invoices running a full month past due. The story is not.
A rough set of bands helps translate the gap between actual DSO and stated terms into action. 15 to 30 days over points to inconsistent follow-up. Beyond 30 days over, invoices simply aren't being chased, and bad-debt risk is climbing.
Sector benchmarks matter after that, but they carry a catch. The Hackett Group's Working Capital Survey found $1.7 trillion trapped in excess working capital across U.S. companies, with DSO degrading for the second year running, driven mainly by customers using their bargaining power to stretch out payment terms. That matters for benchmarking specifically because an industry-wide DSO that's drifting upward can make a company's own deteriorating number look competitive by comparison, when both are actually sliding.
Public-company benchmarks, including those built from datasets like Damodaran's, are often constructed from total revenue. APQC's cross-industry data offers another frame: top-quartile performers collect in 30 days or less, median performers in 38 days or less, and bottom-quartile performers take 46 days or longer. That's a useful cross-sector check, but sector-specific numbers should win whenever they're available.
A company holding steady at 50 days is in better shape than one that was at 38 days last quarter and has slid to 44 this quarter, even though the second company's absolute number still looks better on paper. And the dollar value of fixing DSO scales with revenue: each day of DSO is worth one day of average daily credit sales in freed-up cash, so the payoff from shaving off a few days depends entirely on how large the revenue base is to begin with.
Which calculation finds the real problem when DSO moves
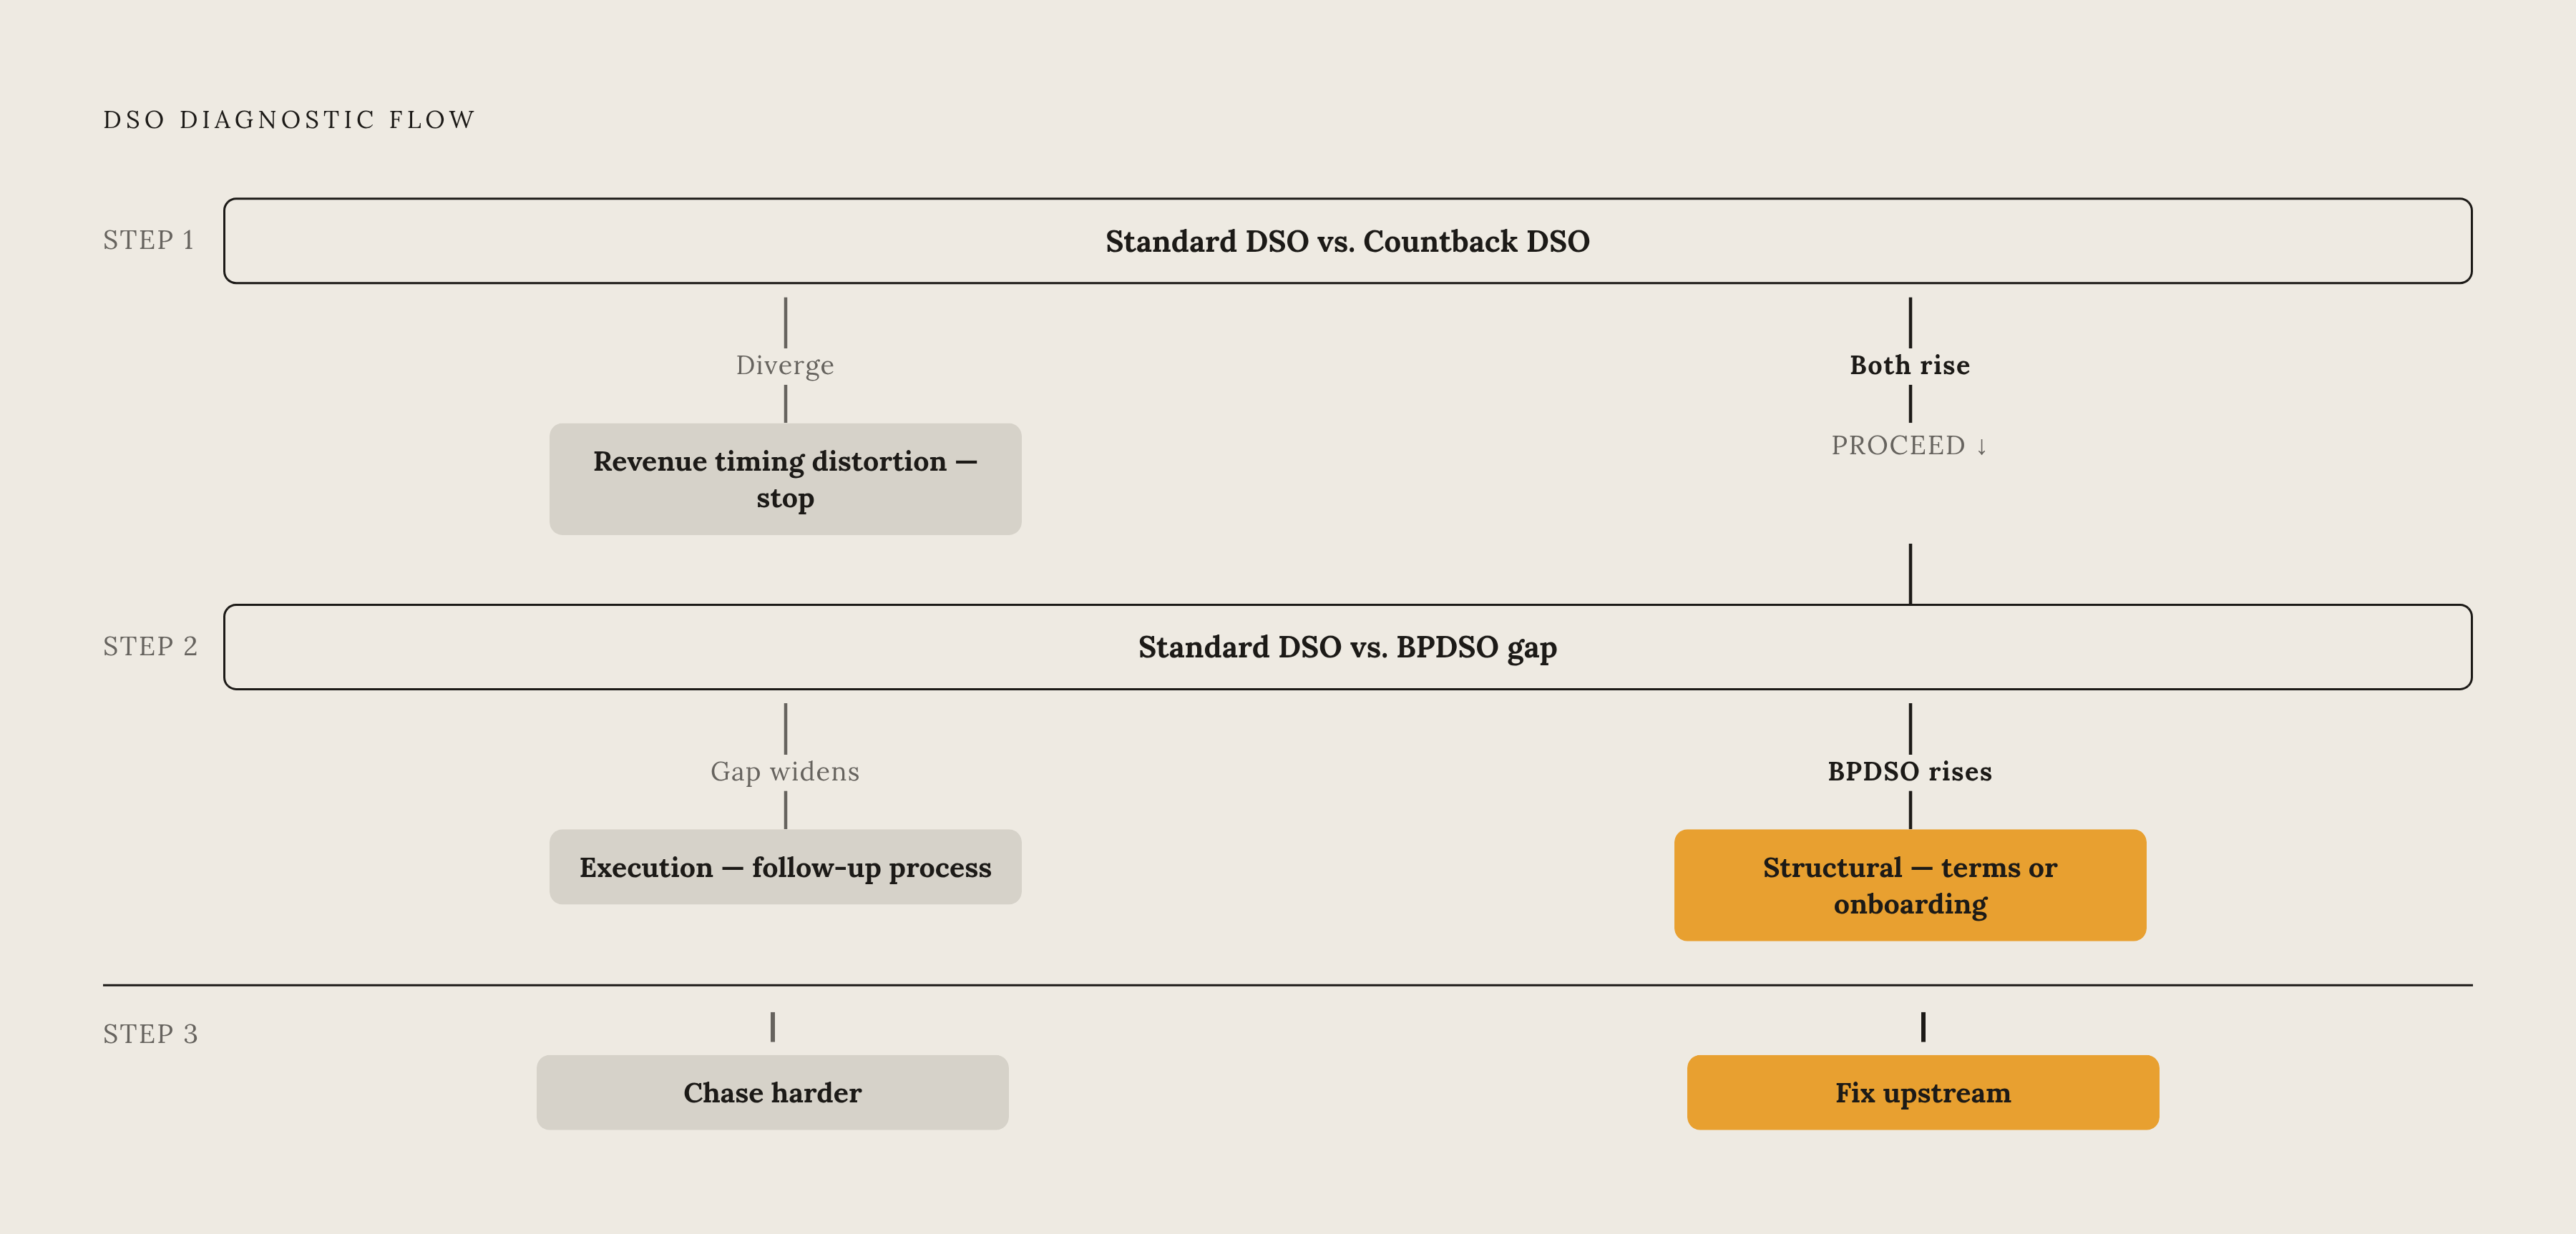
A DSO number moving up or down tells you what to do next only when the method behind it can tell apart a denominator distortion, a structural shift in payment terms, and a genuine collections failure. Most standard setups can't make that distinction on their own. A single number should never trigger a single response.
Start with a side-by-side check: run standard and countback DSO together. If they diverge, the standard number is likely being distorted by revenue timing, and that's not a reason to send the collections team into overdrive. If they move together, something real is happening and deserves attention.
Once standard and countback agree that DSO is rising, bring in BPDSO. If the gap between standard DSO and BPDSO is widening, the issue sits in execution: invoices aren't being chased consistently, or operational friction (missing documents, supplier portal requirements, stalled W-9 forms) is slowing things down in ways reminders alone won't fix. If that gap stays steady while BPDSO itself climbs, the cause is structural: terms are drifting, customer credit quality is shifting, or sales is quietly extending terms to close deals. No amount of chasing invoices fixes a structural problem, because the problem isn't speed, it's the terms themselves.
The least glamorous blockers, missing W-9s, supplier portal registration, approval routing stuck in systems like Coupa or Ariba, never appear as a formula error. Clearing them takes steady, specific follow-up tailored to each obstacle, not a sharper email template.
Choosing the right DSO method in the first place is what tells a finance team whether chasing harder is even the correct move, or whether the real issue sits upstream in credit terms, invoice quality, or how customers get onboarded in the first place.

