AR Turnover Ratio and What It Reveals About Invoice-to-Cash Performance
How to read what your collections performance really reveals about cash conversion speed.

The AR turnover ratio measures how many times a business collects its average accounts receivable balance in a given period. It is a scoreboard for invoice-to-cash performance, and this piece breaks down what drives that score up or down.
What the AR turnover ratio measures
The formula is simple enough to do on a napkin: Net Credit Sales divided by Average Accounts Receivable. Net credit sales means total credit sales minus returns and allowances. Cash sales stay out of the equation entirely, since a cash sale never creates a receivable to track. Average AR takes the beginning balance for the period, adds the ending balance, and divides by two, which keeps one unusually high or low day from skewing the whole picture.
Running the numbers tells you how many times the business collected its average AR balance during that period. Divide 365 by that ratio and the output flips into Days Sales Outstanding, or DSO, the number most finance teams actually watch week to week because "4.2 times a year" is harder to act on than "87 days to get paid."
A higher ratio means cash converts faster, less working capital sits locked up in unpaid invoices, and bad-debt exposure shrinks. A lower ratio means money is parked in receivables longer than it should be, and something in the collection process has friction. What the ratio cannot do, at least not by itself, is say which customers are slow, why invoices are aging, or where the actual breakdown sits. That's the job of everything that follows. The ratio is a scoreboard, not a diagnosis.
Why the same ratio means different things across industries
There is no universal "good" ratio floating out there waiting to be hit. A number that looks great in retail can look alarming in construction, and a number that looks alarming in healthcare can be completely normal. Context turns the ratio from a stray data point into something a finance team can act on.
Healthcare providers typically run around 5 to 7 times annually, and that's not a performance problem. Insurance reimbursement cycles, Medicare and Medicaid billing requirements, and pre-authorization steps all stretch out the time between service and payment, structurally, before anyone even picks up a phone to chase an invoice. Professional services firms show a much wider range year to year, shaped by project billing schedules, retainer arrangements, and how often a client's own budget cycle dictates when checks go out. Payment terms baked into contracts, the presence of third-party payers like insurers or government programs, retainage and milestone billing structures, and plain old customer bargaining power all push the ratio in different directions depending on the industry doing the pushing.
The practical move for a finance leader is to compare the ratio against sector norms first, then against the company's own prior periods. A ratio that sits within normal range for the sector but keeps trending downward over several quarters deserves more urgency than a number that looks low in isolation but has held steady for years. And a ratio that looks suspiciously good carries its own warning label. Credit terms tightened to the point of scaring off larger customers, or terms so rigid they spark constant disputes, will push the ratio higher while quietly damaging the business in ways the ratio doesn't measure. The ratio rewards speed. It says nothing about customer retention or deal size.
DSO's ongoing decline
The broader trend across large companies is not improvement. DSO has worsened for two consecutive years at the large-company level, and the gap between top-performing companies and median performers now represents a massive opportunity cost sitting on balance sheets that could otherwise fund growth. That gap is structural: the operational breakdowns dragging ratios down appear across the board, not in a handful of unlucky companies.
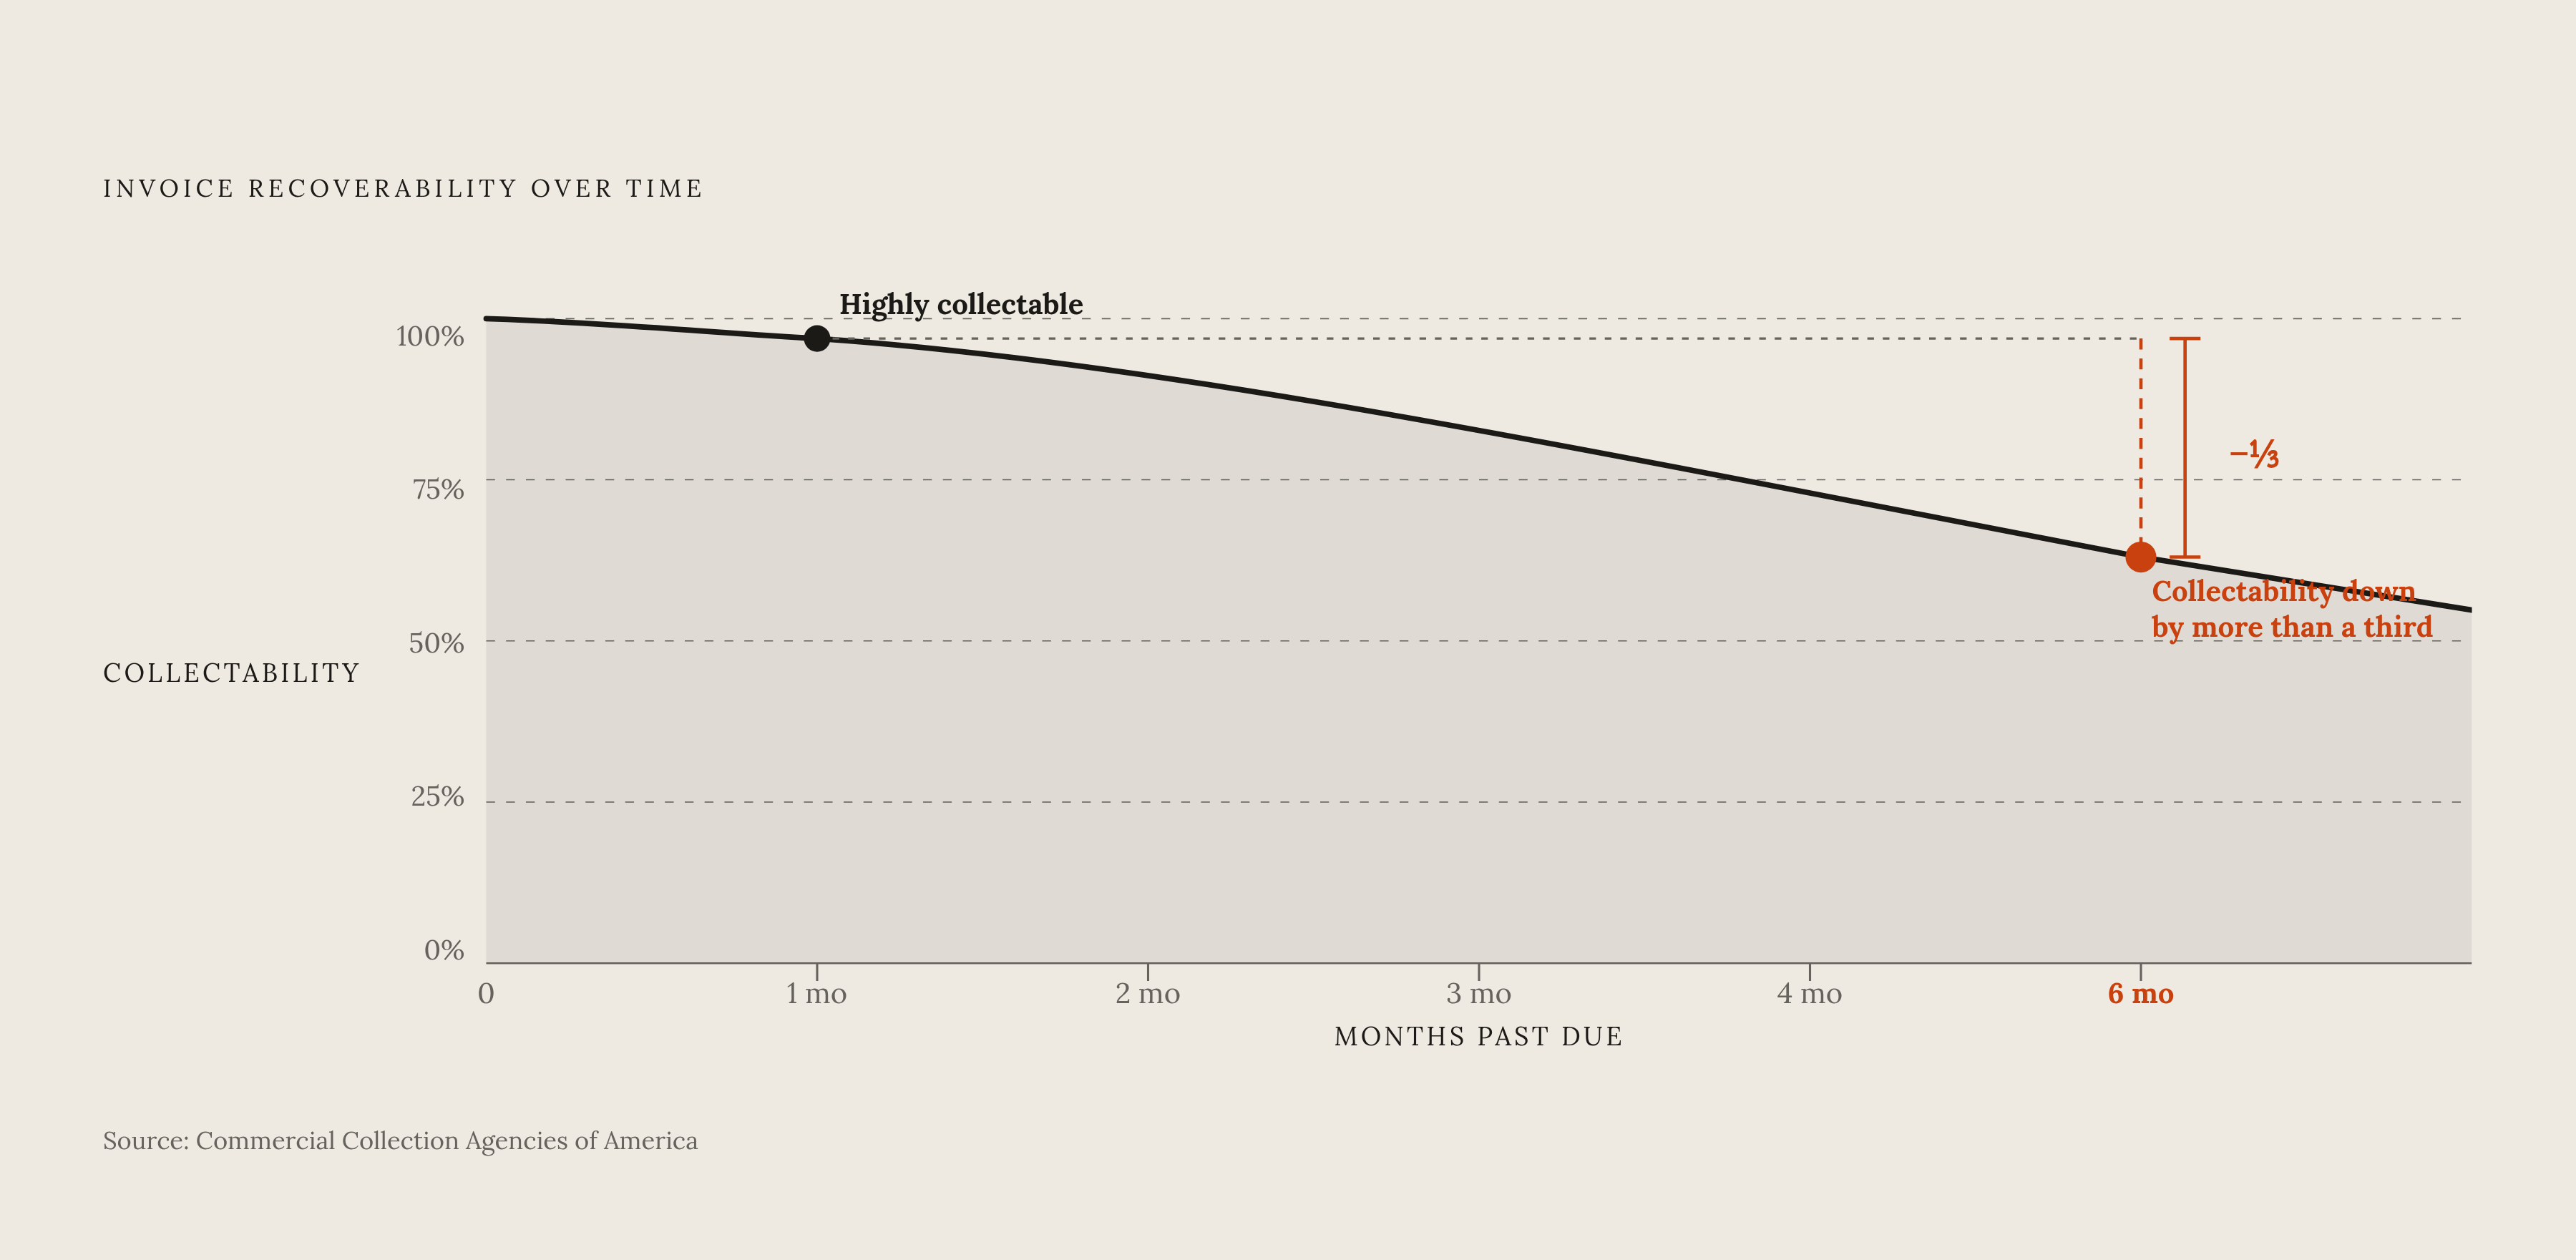
Customer bargaining power explains most of this. Buyers are extending payment terms because they can, and a lot of suppliers are absorbing the hit. Every week that absorption continues is a week closer to what might be called the collectability cliff: a receivable one month past due is still highly collectable, but collectability falls by more than a third by the six-month mark, based on data from the Commercial Collection Agencies of America. The calendar itself destroys recoverable value as it turns. A declining AR turnover ratio isn't just a cash-flow headache that resolves itself eventually. It carries a real write-down risk attached to every day it continues.
None of this deterioration is inevitable, though. Applied Industrial Technologies (NYSE: AIT) shows what disciplined AR management looks like even inside a tough environment. That's bad-debt exposure shrinking in the same macro climate where most companies are watching it grow. For finance teams, the lesson sitting inside that filing is straightforward: every week an invoice goes uncollected moves it measurably closer to the cliff, and the ratio functions less like a quarterly report card and more like a real-time gauge of money at risk.
What the ratio cannot see on its own
The ratio delivers a score, but it was never built to explain the score. It cannot say which customers are dragging the number down, whether the real issue is a follow-up gap, a stuck portal, a missing document, or a dispute nobody has resolved yet. Four blind spots sit inside the ratio no matter how carefully it's calculated.
A healthy overall ratio can mask one or two large, slow-paying customers whose eventual delinquency threatens the business, because averages by design hide concentration. Industries with lumpy collection cycles, construction collecting heavily in summer months being a good example, produce annual averages that smooth over real seasonal volatility and hide the swings a monthly view would catch. Credit-term changes can inflate the ratio without any actual improvement in collections: tighten terms from Net 60 to Net 30 mid-year and the ratio climbs because the denominator got smaller, not because the team collected faster. The underlying process never changed. Invoice-origin errors stay invisible to the ratio. If a sale gets recorded before a validated invoice reaches the customer, the finance team sees what looks like a collections problem when the actual failure happened upstream, in invoice accuracy, not in anyone's follow-up effort.
The fix is to pair the ratio with tools built for diagnosis rather than scorekeeping: AR aging buckets to reveal concentration and duration, the Collection Effectiveness Index to measure how well follow-up is actually working, and average days delinquent to separate structural slowness from genuine operational failure. A team watching the ratio alone manages the number while the cash behind it goes untracked. The next sections work through the specific breakdowns that number has been hiding.
How aging invoices reveal where cash is stuck
The AR aging report turns the ratio into a map by sorting every invoice by how overdue it is, from current to slightly past due to moderately past due to significantly past due to severely overdue, and the shape of that distribution is where real diagnosis starts.
A small cluster of large invoices sitting in the later buckets can account for most of a company's DSO drag while the rest of the portfolio performs perfectly well, which is a very different problem than a broad spread of many small invoices stuck in the mid-range. The second pattern usually points to a systemic follow-up failure touching the whole process.
Reading the aging report next to the ratio sharpens the diagnosis further. A declining ratio paired with a growing 60-plus bucket points to a persistence problem: follow-up isn't happening often enough or early enough. A declining ratio paired with a crowded 31-to-60 bucket suggests the issue sits earlier, in invoice delivery, formatting, or how fast the first follow-up goes out. A ratio that looks perfectly stable can still hide a handful of accounts camped in the 90-plus bucket, with the average quietly covering for a concentration risk that's one bad quarter away from becoming a write-off.
The Collection Effectiveness Index works as the natural companion metric here. Where the aging report shows where the cash is physically stuck, CEI measures how effectively the team is converting what's outstanding into cash collected. A low CEI paired with a crowded aging report confirms the constraint is follow-up, not customer intent. Knowing which invoices are aging answers the "where." It doesn't yet answer "why," and that question is where the next two sections live.
The follow-up gap: why invoices age even when customers intend to pay
Most aging invoices do not belong to customers who refuse to pay. They belong to processes where follow-up happens too rarely, too late, or in a form easy to ignore. Closing that gap is often the single highest-leverage fix available to a finance team, more valuable than renegotiating terms or chasing new credit policies.
Manual AR processes run on whatever bandwidth the team has left after everything else. A large invoice can go two or three weeks between touches as a result. That's plenty of time for a customer to quietly deprioritize payment with zero consequence. A generic reminder email that just says "please see attached invoice" doesn't convey urgency, doesn't reference the customer's specific account or situation, and gets filtered into a folder nobody opens. Escalation paths often don't exist in any defined form either: there's no agreed trigger for what happens as an invoice ages through each stage, so invoices drift until they become emergencies.
Structured follow-up looks different in practice. It runs on a defined cadence: a reminder before the due date, a reminder on the due date, a prompt follow-up the moment an invoice goes past due, and increasing frequency from there as the invoice ages further. Each message references the specific invoice, the exact amount, and the agreed terms rather than reading like a template blasted to a mailing list. Escalation has a clear trigger built in: no response by a set day moves the contact up to a senior stakeholder or shifts it to a different communication channel.
The compounding math here is unforgiving. Every day follow-up gets delayed moves the invoice closer to the collectability cliff described earlier, and a two-week gap in outreach on a 60-day invoice can be the entire difference between getting paid and writing it off. The need is for follow-up that functions as a persistent, always-on operation instead of a periodic task squeezed in between other priorities, matching a frequency and escalation logic that a manual process, no matter how well-intentioned, struggles to sustain once the invoice count climbs. An AI-powered AR function built around that logic can hold the cadence steady across hundreds of accounts at once, which is exactly the scale where manual follow-up tends to break down first.
Portal friction and missing documents as hidden ratio killers
Even a company with airtight follow-up and perfectly accurate invoices can still watch its ratio slide, because a lot of large buyers route payment through procurement portals like Coupa or Ariba, where an invoice can sit unprocessed for weeks without sending any signal back to the supplier.
An invoice submitted into one of these portals counts as "sent" from the supplier's side of the ledger, but it might sit rejected, held for approval, or parked in a queue nobody is actively watching. The portal doesn't proactively notify the supplier when something goes wrong. The team usually finds out only by logging in to check status, which might not happen for days or even weeks after the fact. Every rejection resets the clock too: the invoice gets corrected, resubmitted, and the payment term countdown starts over from the resubmission date rather than the original invoice date, pushing the whole timeline backward.
Missing documents create a parallel version of the same trap. A W-9 that was never collected, a purchase order number left off the invoice, a signed delivery confirmation that accounts payable requires before it will even look at the invoice: any single one of these can put payment on hold indefinitely. The supplier's AR team often doesn't know a document is missing until they ask directly, and by the time they do, the invoice may already sit past due against the buyer's original terms.
The ratio and the aging report don't capture any of this. A portal-held invoice looks identical to any other unpaid invoice in an aging bucket, whether the customer is refusing to pay or the invoice is simply stuck in an approval queue waiting on a W-9 nobody collected months ago. The fix is to treat portal status like something that needs regular checking rather than something to wait on passively, logging into customer portals on a set schedule instead of waiting for a payment confirmation that may never come without intervention. Pairing that with a checklist built at the moment of invoice creation, flagging missing W-9s, PO numbers, and required attachments before the invoice goes out the door, closes off a failure mode the ratio was never built to catch.